Automating Efficiency of Go programs with Profile-Guided Optimizations

Introduction
Profile-guided optimization improves the performance of compiled code by using runtime profiling data to inform compiler optimizations. This technique, recently integrated into Go, improves traditional optimizations such as function inlining, basic block and function reordering, register allocation, and more. At Uber, we’ve implemented PGO (profile-guided optimization) in a continuous optimization framework that includes daily profile collection, service-specific enrollment, CI testing, deployment, and performance monitoring. We addressed initial challenges related to increased build times by introducing a profile preprocessing tool, which significantly reduced compilation times. While measuring the impact at a fleet-wide level is difficult, we conducted performance benchmarks and real-world service evaluations at Uber. The results showed efficiency gains and reduced resource utilization for some specific services, validating the effectiveness of PGO-driven optimizations. Support for PGO in Golang was introduced in v1.20 and later improved in later versions through our fruitful collaboration with Google®. This blog describes our experience building core components of PGO and deploying it at Uber.
Background
Profile-guided optimization uses the profile collected during a representative run to generate better code. At a high level, it can be divided into the following phases: profiling, analysis, and recompilation. Multiple languages already support PGO, including C/C++, Rust, Java, and Swift. However, this support was lacking for Golang, which led us to build this functionality in collaboration with Google.
Many compiler optimizations, such as inlining, register allocation, and instruction scheduling often use statically inferred estimates related to caller-callee frequencies, basic-block frequencies, and branch probabilities to guide optimization. The static estimation of these metrics may lead to suboptimal code generated by the compiler. These optimizations can easily benefit from dynamic information collected by profiling an application.
Traditionally, a PGO-based compilation begins with an instrumentation phase to generate an instrumented version of the application. Next, the instrumented program runs with training data to collect the profile (that is, edge profiles). These profiles are later fed to the compiler and the application is recompiled to produce an optimized binary. During this process, the compiler updates and propagates profile information, including feeding them to compiler passes to optimize hot/code paths. Modern compilers such as LLVM have incorporated PGO and reported speed-ups of around 20%. Since the instrumented execution of an application incurs significant overhead, recent work has shown little or no performance loss by collecting execution profiles via sampling, leveraging tools like hardware performance counter and pprof.
Go binaries are often large as they’re statically linked and include all dependent packages and runtimes. For such large binaries, misses in the instruction cache and TLB can cause stalled cycles in the CPU’s front end leading to performance degradation. Profile-guided code-layout optimization is known to alleviate this problem. Recent work including Meta® BOLT and Google® Propeller have shown more than 10% performance improvements by optimizing code locality in data center workloads. Code-layout optimization improves code locality and comprises basic-block layout, function splitting, and function reordering optimizations. To reap maximum performance benefits, these optimizations are typically performed during or post link-time using profiling information.
Overview of PGO: Continuous Optimization Framework
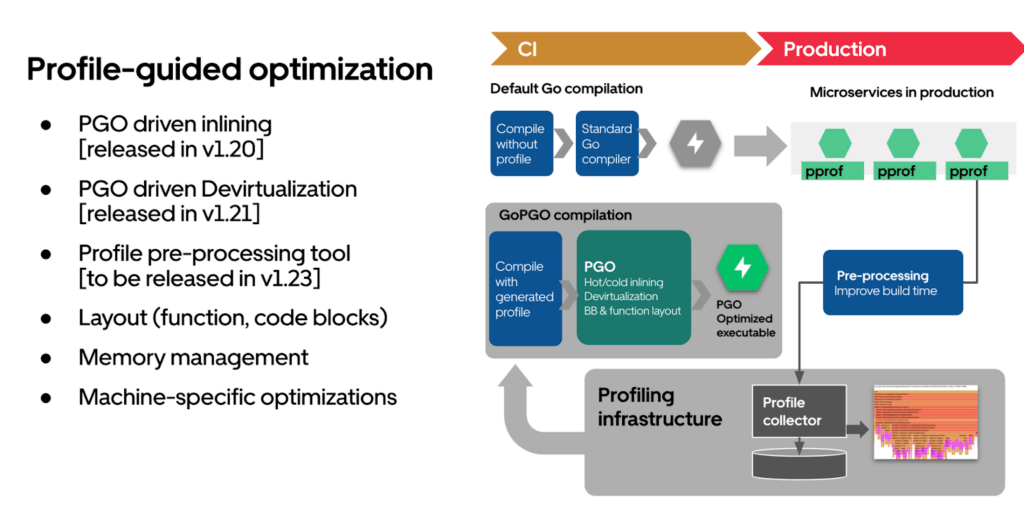
Let’s review the timeline of key PGO features:
- PGO-driven inlining was introduced in version 1.20
- In version 1.21, PGO-driven devirtualization was added, further optimizing execution efficiency
- A profile pre-processing tool was released in version 1.23 to drastically improve build times
The PGO framework at Uber is a continuous optimization process. Profiles are collected and used during the GoPGO compilation process. Optimized executables are then deployed in production, with pre-processing steps included to improve build times.
Enabling PGO in our build and deployment process involves several steps:
- We collect performance profiles daily to ensure we have up-to-date data for guiding optimizations.
- We maintain a configuration system to enroll specific services for Go PGO, ensuring that only selected services undergo these optimizations.
- We perform CI tests for the PGO SDK to validate the changes and ensure they don’t introduce any stability issues.
- Once the tests pass, we deploy the PGO-built services into our production environment.
- Finally, we monitor the performance dashboard to track the impact of PGO on our services.
By following these steps, we systematically integrate PGO into our build and deployment pipeline, enhancing the performance and efficiency of our services.
Inlining
Function inlining is one of the most common optimizations that benefits from PGO. PGO inlining is a compiler technique that uses runtime profiling data to optimize function inlining decisions. The first step is collecting profiling data during program execution to identify frequently executed (hot) functions. Then, the compiler uses this data to selectively inline these hot functions, reducing function call overhead. This approach leads to more efficient code, unlike traditional static inlining heuristics, which don’t account for actual runtime behavior.
Profile Collection
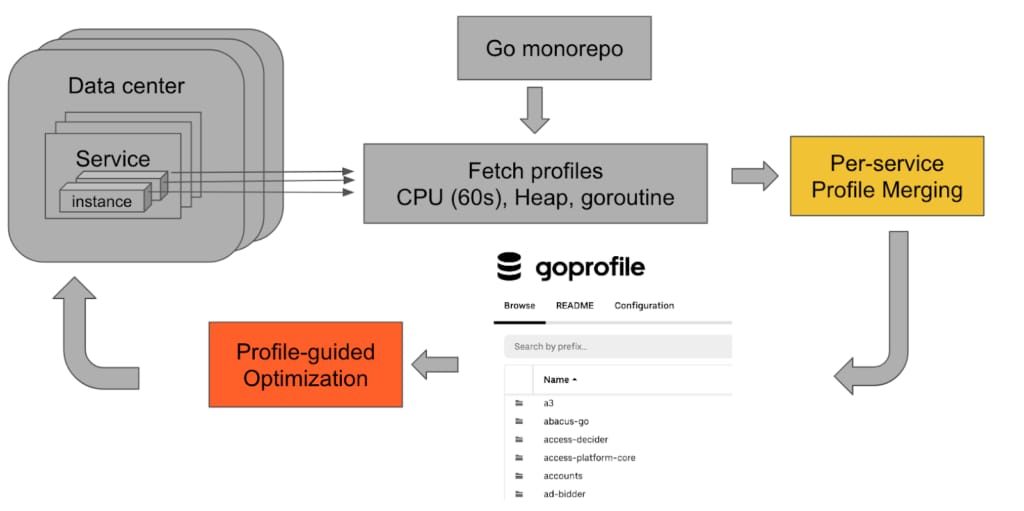
Our profiling infrastructure is designed to work seamlessly within a distributed system in production.
We collect continuous profiling data from multiple instances and merge these profiles to create a representative profile.
Preprocessing
After deploying PGO in our production environment, we observed a significant increase in build times across multiple services, with some experiencing delays of up to 8 times. This increase posed challenges for developers and service owners, making it crucial to address the issue promptly.
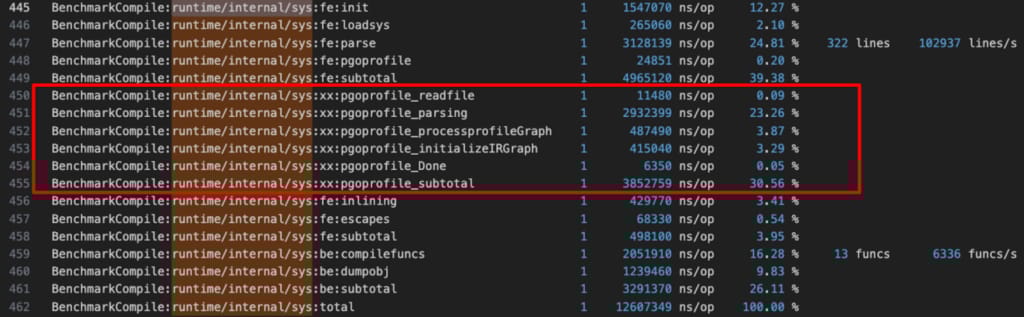
To identify the root cause of the compilation time degradation, we analyzed the compiler’s performance and found that pprof data parsing accounted for a significant portion—up to 95%—of the total compilation time when the PGO flow was enabled. Additionally, the repeated reading and parsing of the pprof file for each package compilation contributed significantly to the cumulative overhead.
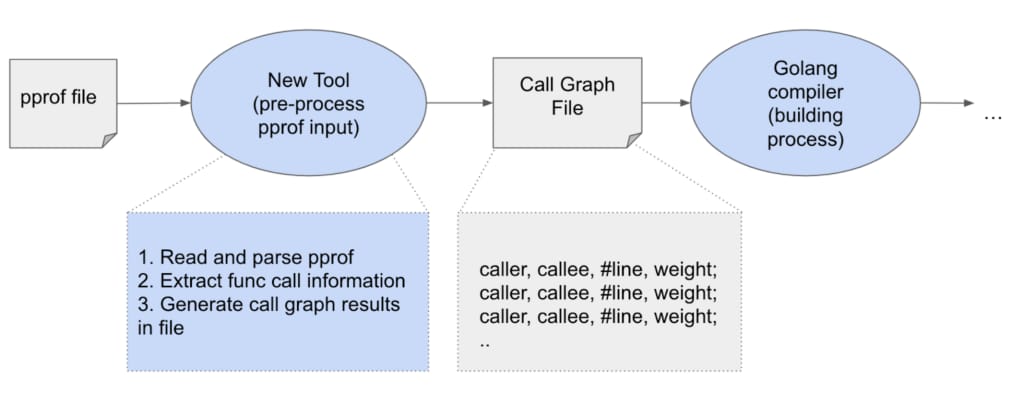
To mitigate the slow compilation, we proposed an offline tool to preprocess the profile. The PGO preprocessor tool involves extracting runtime profiling data, generating and caching intermediate call graphs, and using call graph information for further analysis and optimization during the compilation process in Go compiler. The tool is already up-streamed and approved into the community open-source version.
Here are the basic steps involved in the PGO preprocessor in the Go compiler:
- Extract runtime profiling data: We use pprof profiles as input for the preprocessor tool. The new tool reads and parses profiling data once and extracts function call information of the Go program captured in the profiling data.
- Construct call graphs: The extracted profiling information is converted to a call graph with node and edge weights (called WeightedCallGraph). The call graph is cached in a certain format, including the information of the function caller, callee, address, and weights. The graph is used as input to guide optimizations in the Go compiler, specifically targeting hotpaths in the code. Optimizations such as inlining and devirtualization use profiling information to optimize hot paths for improved performance.
- Feed the output to the compiler: The optimized code produced by the PGO-enabled compiler is linked with the rest of the program to create the final executable. During this phase, we enable link-time code and data layout optimization based on profile information to order the functions and data.
To make the compilation even faster, we execute the preprocessing tool on the most recently collected fleet-wide profiles every day. As a result, the production build can use the latest processed profile right away.
Thanks to the preprocessing tool, PGO build times were significantly reduced, with most services experiencing only a minimal increase compared to their original durations.
Performance Impact
In this section, we show the performance impact of PGO inlining on synthetic benchmarks and on Uber services.
Synthetic benchmarks
First, we show the performance impact of PGO on open-source synthetic benchmarks. The data is collected on a server with Intel® Xeon® Gold 6136 CPU, 128GB of memory, and Linux® version 6.8.0.
go-json is one of the most widely used third-party JSON libraries in Go. It provides comprehensive benchmarks for performance. We run the benchmarks on all standard encoding/JSON libraries with 20 iterations on all benchmarks.
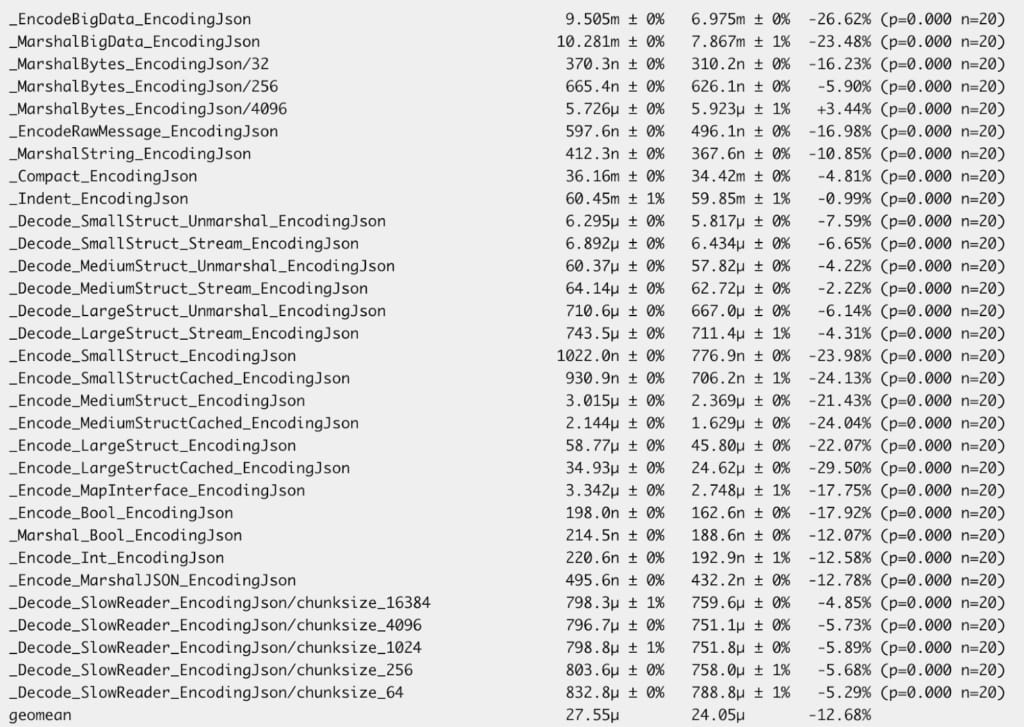
Overall, the PGO-driven inlining delivers a 12% performance improvement for the entire benchmark. A lot of microbenchmarks show more than 20% performance gain.
The reason for the performance improvement can also be validated by inspecting the iTLB (instruction translation lookaside buffer) misses. Comparing the number of misses from the original benchmark and the PGO-compiled binary in Figure 6, we can see that PGO can greatly reduce the number of iTLB misses by 30%.
| Baseline | PGO | Change | |
| Instructions | 2.84E+12 | 2.77E+12 | -2.41% |
| Cycles | 9.34E+11 | 9.10E+11 | -2.51% |
| L1-icache-misses | 2.22E+09 | 1.98E+09 | -10.78% |
| iTLB-misses | 5.07E+06 | 3.31E+06 | -34.64% |
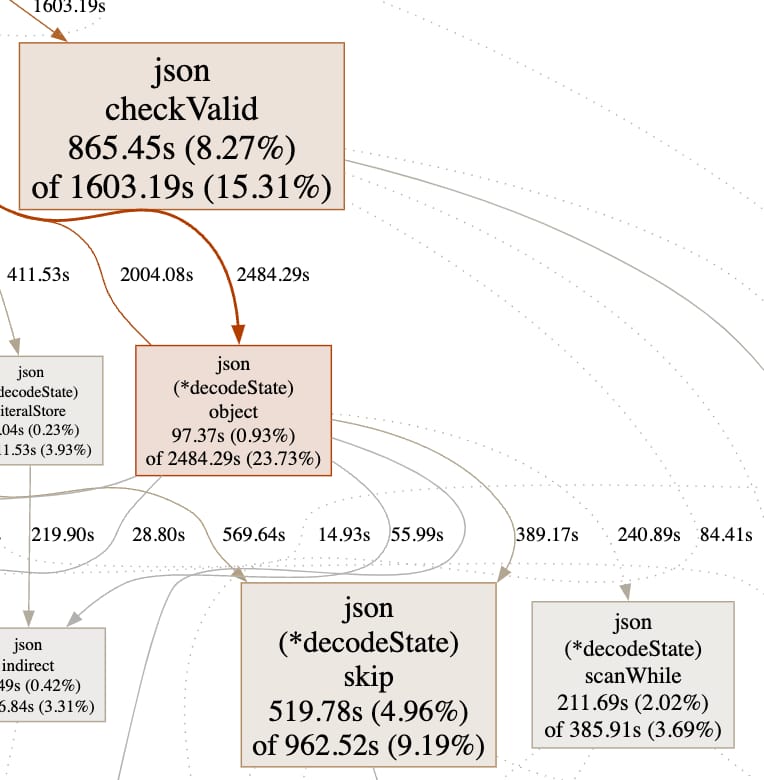
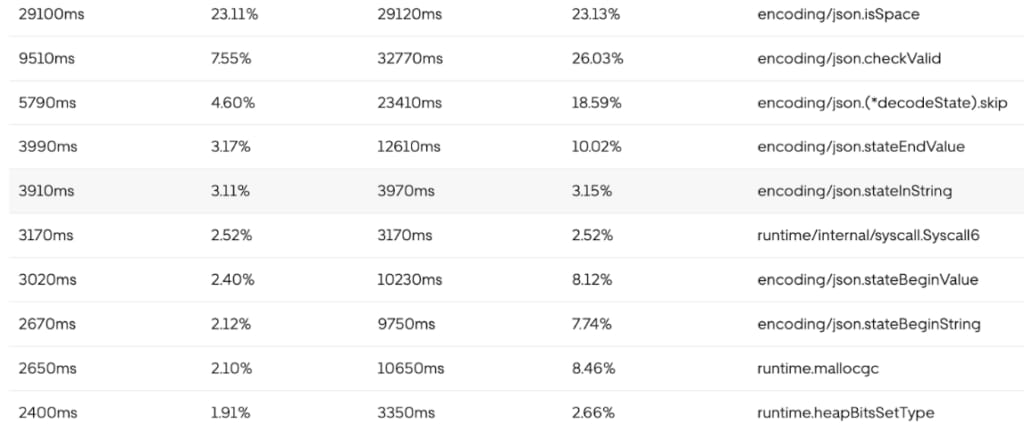
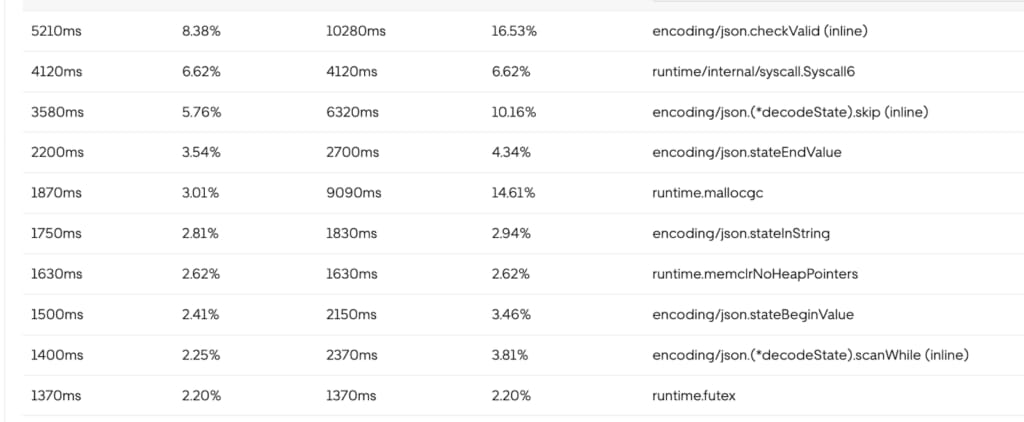
We also investigated the profile of PGO and non-PGO runs. We found that the default inliner can’t inline those hot functions (such as checkValid in Figure 7) since the body size is larger than the default inliner budget. After the inliner budget is increased with PGO build, those 3 functions can be inlined. We also noticed the PGO inliner slightly increases the number of inlining call sites.
We also investigated the reason for the performance improvement. In the baseline version, 35,545 call sites were inlined, where 36,544 call sites were inlined in the PGO version.
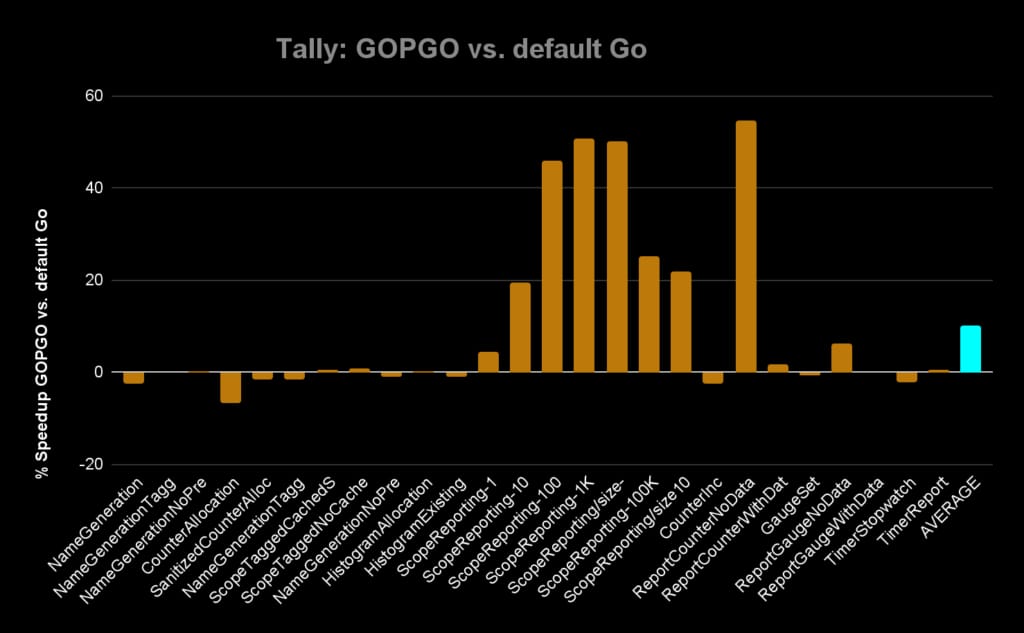
Tally is a popular library for fast, buffered, and hierarchical stats collection. After we apply PGO-driven inlining, it delivers an average 10% performance gain, and some of the microbenchmarks show more than 50% improvement.
Enrolling Uber Services
We currently enroll several thousand services at Uber with PGO. However, measuring PGO performance presents several challenges. One key difficulty is the lack of A/B performance measurement support in production with different compiled binaries, making it hard to directly compare PGO-optimized and non-optimized versions. Additionally, CPU usage can be significantly influenced by traffic variations (requests per second), which can fluctuate and skew results. The default autoscaling feature further complicates this by dynamically adjusting resources, making it difficult to isolate the impact of PGO. Moreover, ongoing changes to the service’s source code during the measurement period can introduce variability, making it challenging to attribute performance improvements solely to PGO optimizations.
After extensive exploration of different methodologies, we found the best approach to measure impact is by comparing performance metrics for 7 days before and 7 days after enabling PGO.
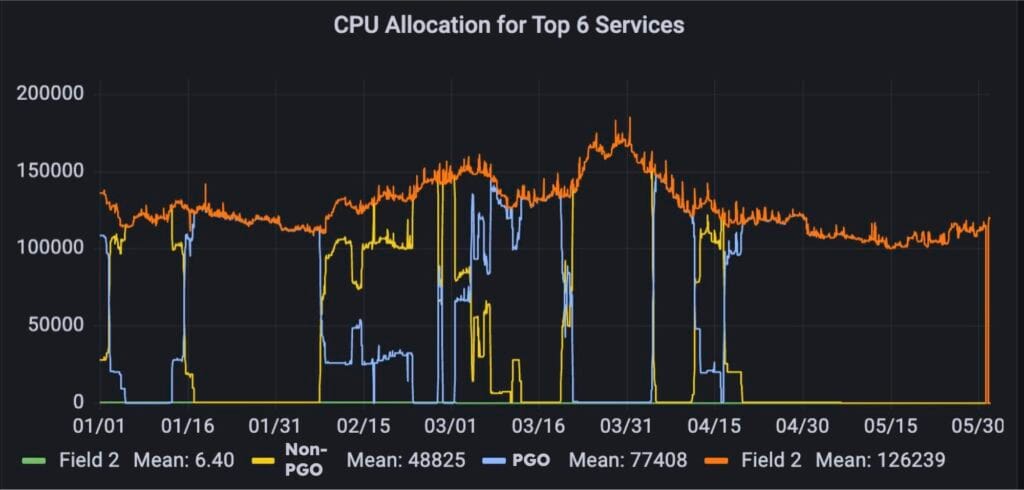
We selected the top 6 services and measured CPU allocations with PGO enabled and disabled, as shown in Figure 9. The y-axis represents the number of CPU cores. The yellow line shows the number of cores when PGO is disabled, while the blue line represents the number of cores when PGO is enabled. Since 4/18/24, we’ve observed a reduction in the number of cores with PGO enabled. However, due to autoscaling and varying RPS, we need to establish a method to correlate that the reduction in CPU allocation is directly related to PGO.
To verify the measured gain of PGO is real, we compared the profiles of non-PGO (Figure 10a) and PGO (Figure 10b) runs. It’s clear that the important functions such as checkValid aren’t inlined by default, but will be inlined with the PGO build. Therefore, we can draw the conclusion that measured gain does mostly come from PGO.
Conclusion
Profile-guided optimizations can significantly enhance software performance by using runtime data to guide compiler optimizations. At Uber, PGO led to a ~4% performance gain through inlining optimizations and a reduction of 24,000 CPU cores across top services. Measuring PGO’s impact can be complex, but this analysis demonstrates its value in optimizing resource utilization and achieving substantial performance improvements.
Acknowledgments
We’d like to acknowledge former team member Jin Lin for designing, implementing, and upstreaming PGO inline and basic block reordering. Jin also measured PGO performance changes internally. We also extend our gratitude to former team manager Raj Barik for designing, implementing, and upstreaming type specialization.
Additionally, we thank our former interns, Ghadeer Alabandi and Swastik Mittal, for their contributions. We’re grateful to our colleagues at Uber, including Rasmus Vestergaard, Sung Wang, Zhongpeng Lin, Haiming Tian, Anthony Blelloch, Saurabh Agrawal, Tapan Thaker, Curtis Patrick, Lasse Vilhelmsen, Paweł Królikowski, Sergey Balabanov, Niels Lindgren, Tony Alaniz, Cristian Velazquez, Kanad Sinha, Siyang Liu, Minglei Wang, Johan Mena, Taiwon Chung, Ryan Hang, and Jacob Oaks.
Finally, we’d like to thank Michael Pratt, Cherry Mui, and Austin Clements from the Google Go compiler team for their support and collaboration.
Cover Photo Attribution: Image generated using the ImageGen3 AI model.
Google® is a registered trademark of Google Inc.
Linux® is the registered trademark of Linus Torvalds in the U.S. and other countries.
Meta® is a registered trademark of Meta Inc.
Java, MySQL, and NetSuite are registered trademarks of Oracle® and/or its affiliates.
Swift® and the Swift logo are trademarks of Apple® Inc.
Xeon® is a trademark of Intel® Corporation or its subsidiaries.